A painful 2022
Written by Editor on June 12, 2026

TL;DR
In 2022, stocks and bonds fell together, breaking the diversification retirees usually count on. It changed how I approach investing: even a passive portfolio needs active risk management. I used backtested data on three iShares ETFs to see exactly how hard bonds were hit, and why.
What happened in 2022?
The short answer is: financially, not a lot of good stuff.
In 2022, the US stock market lost almost 20%, while European markets fared slightly better but still saw declines of around 10% to 13%. And remarkably, bonds did not provide their usual safety net.
In the decade leading up to 2022, bonds had been a reliable diversifier for stocks. But in 2022, driven by soaring inflation, the correlation between stocks and bonds flipped to positive. Instead of balancing each other out, both asset classes lost money simultaneously.
To illustrate what happened I made a Python tool that combines three ETFs that cover the Eurozone:
| ISIN | Name |
|---|---|
| IE00B53L3W79 | iShares Core EURO STOXX 50 UCITS ETF |
| IE00BF11F565 | iShares Core € Corp Bond UCITS ETF |
| IE000RHYOR04 | iShares € Ultrashort Bond UCITS ETF |
Table: ETFs used in analysis
I used data provided by iShares to generate the chart below that graphs cumulative returns. NB. iShares offers an excellent comparison tool. Unfortunately it did not (yet) provide a chart when I made this post. Look at the top right when you visit the iShares website for the comparison tool. Very handy.
My chart shows ETFs for the STOXX 50 (orange), the EUR corporate bond fund (blue, 4 to 5-year maturity), and the EUR bond fund with a very short maturity of less than a year (green, data starting from 2022). The period covered is 2018 to 2025.
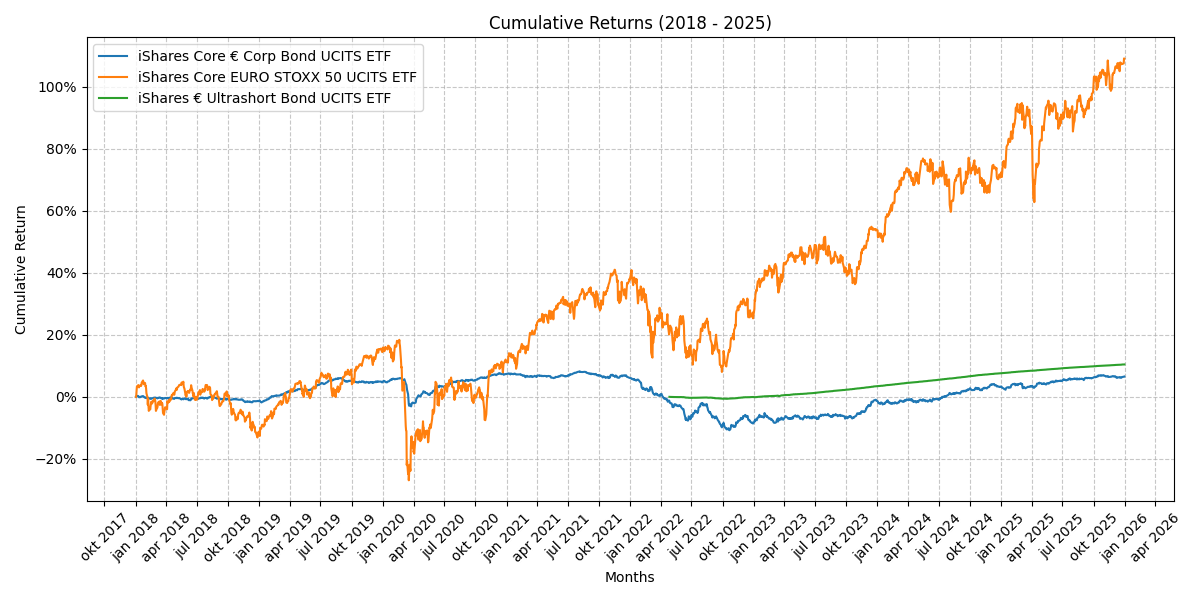
You can probably spot the Covid crisis in 2020: a sharp downward movement in the STOXX 50 ETF but not so much in the EUR Corporate Bond one.
If you look a bit further to 2022 you can see another, more prolonged, downward move. This time, the EUR Corporate Bond ETF moved down as well. In 2023 the equity ETF recovered fully; the EUR Corporate Bond ETF did not.
Later, in April 2025, you see the effects of Liberation Day. Afterwards, a strong upward movement in the equity ETF but not so much in the bond ETFs. These did not seem to be affected that much by this crisis.
To zoom in on 2022 and 2023, I created the same chart but just for these years.
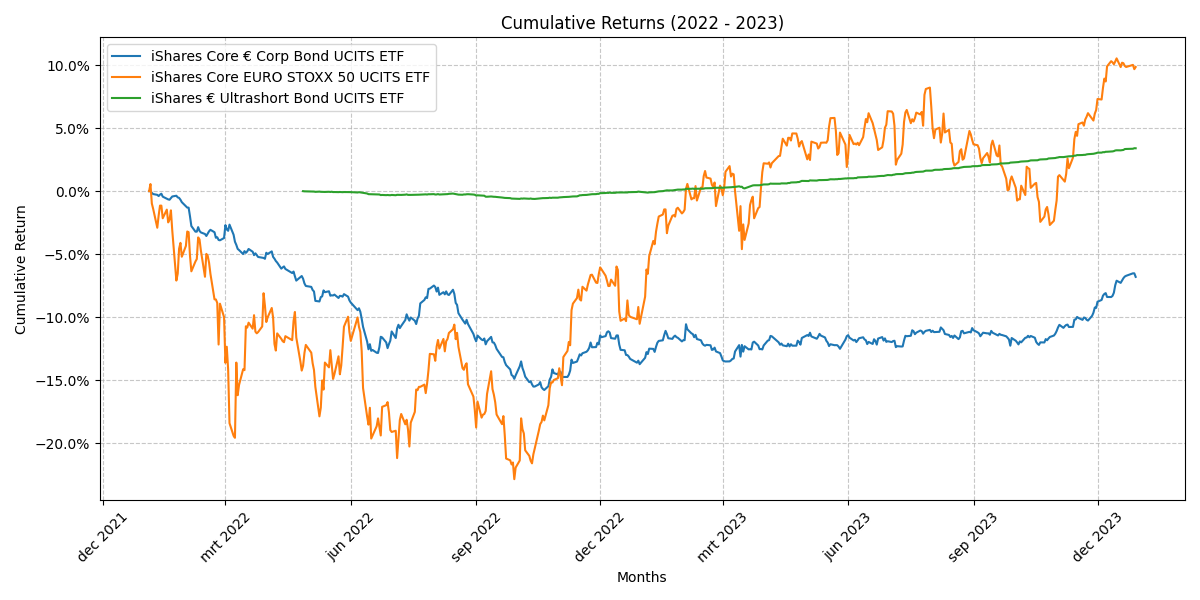
The chart clearly shows the volatile movements of the STOXX 50 ETF in a strong downtrend. The EUR Corporate Bond ETF was not as volatile but also shows a clear downtrend.
In the last quarter of 2022 the STOXX 50 ETF started to recover. It fully recovered by the end of the first quarter of 2023. The EUR Corporate Bond ETF could not fully recover in 2023. It could hardly bend the downtrend.
Notice how flat the EUR Ultrashort Bond is. As expected for a cash-equivalent, it barely reacted. Its slow, steady increase reflects the incorporation of rising interest rates.
Why were stocks and bonds suddenly positively correlated instead of negatively? Two main causes:
- Rapidly rising inflation and the interest rate hikes to counter it. At the time this all started, interest rates were close to zero, so the hikes had a massive impact. Stocks, especially tech and other growth stocks, suffered because capital became more expensive. Over 2022 and 2023 the ECB implemented no fewer than 10 rate hikes for a total of 450 bps.
- The switch from Quantitative Easing to Quantitative Tightening. Simply put: money was pulled out of the markets instead of pumped in. Note that Europe started later than the US and did it in a much less aggressive manner.
At the start of 2022, I had just begun buying bond ETFs, including the two discussed here, to reduce portfolio volatility. By the second quarter, I stopped buying iShares Core € Corp Bond UCITS ETF once the direction of the bond market became obvious.
Some numbers
I used my Python tool to generate the data in the tables below for the years 2018 to 2025. The data illustrates how hard bonds were hit.
| 2018 - 2025 | iShares Core € Corp Bond UCITS ETF | iShares Core EURO STOXX 50 UCITS ETF | iShares € Ultrashort Bond UCITS ETF |
|---|---|---|---|
| Average | 3.26% | 17.69% | 0.24% |
Table 1: Average Yearly Standard Deviation
| Year | iShares Core € Corp Bond UCITS ETF | iShares Core EURO STOXX 50 UCITS ETF | iShares € Ultrashort Bond UCITS ETF |
|---|---|---|---|
| 2025 | 6.51% | 108.97% | 10.44% |
Table 2: Cumulative Returns (2018-2025)
| Year | iShares Core € Corp Bond UCITS ETF | iShares Core EURO STOXX 50 UCITS ETF | iShares € Ultrashort Bond UCITS ETF |
|---|---|---|---|
| 2018 | -1.36% | -11.20% | N/A |
| 2019 | 6.14% | 28.86% | N/A |
| 2020 | 2.53% | -2.89% | N/A |
| 2021 | -1.14% | 23.98% | N/A |
| 2022 | -13.86% | -9.04% | -0.07% |
| 2023 | 8.04% | 22.78% | 3.46% |
| 2024 | 4.58% | 11.54% | 4.05% |
| 2025 | 3.13% | 21.78% | 2.65% |
| Average | 1.01% | 10.73% | 2.52% |
Table 3: Annualised Returns
As seen in Table 1, the Core € Corp Bond ETF is much less volatile than the EUR STOXX 50 ETF, but that lower volatility didn’t help protect its returns. As expected, the EUR Ultrashort Bond showed almost no volatility. Shown in Table 2, it also performed much better than the Corporate Bond fund. Please observe that we have fewer years of data for the Ultrashort Bond ETF. It is a relatively young product.
Table 3 makes clear how devastating the impact of 2022 was for the EUR Corporate Bond ETF. The average return for the ETF was reduced to a puny 1% for 2018-2025. The Ultrashort Bond ETF did better.
I also checked two USD bond ETFs for comparison:
| ISIN | Name |
|---|---|
| IE00BGCSB447 | iShares USD Ultrashort Bond UCITS ETF USD (Acc) |
| IE00BYXYYJ35 | iShares USD Corporate Bond UCITS ETF (Acc) |
Table: USD Bond Funds
From 2018-2025 these two USD funds performed about the same, but they followed a different path in the earlier years. However, from July 2022 onward their charts are similar.
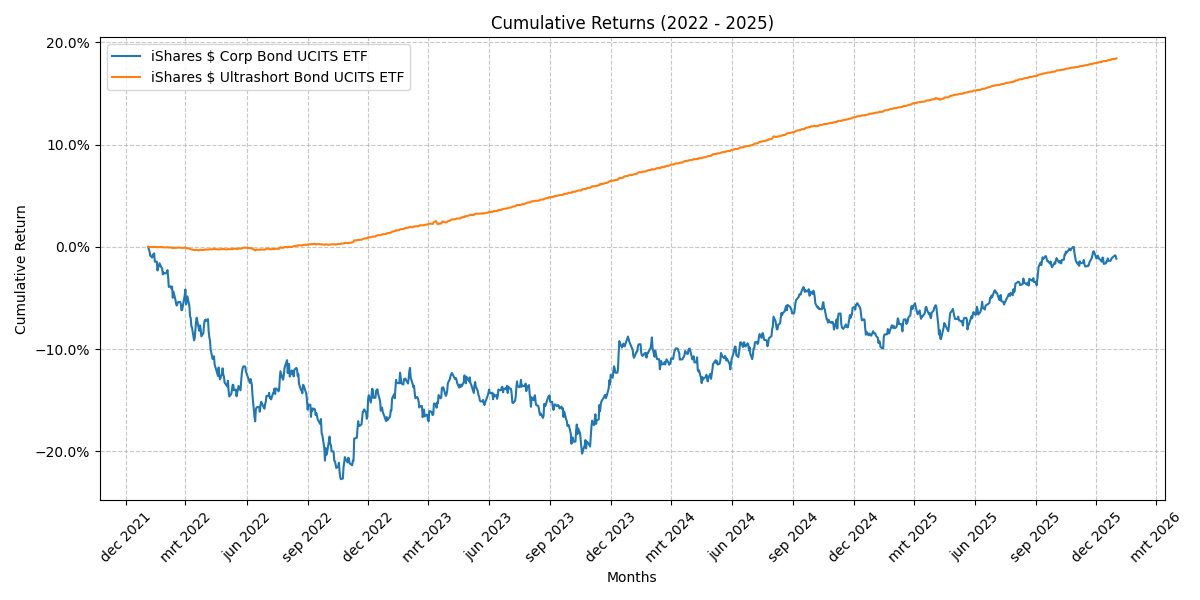
I then compared the two EUR bond funds with the two USD ones using iShares Compare ETF-tool. Really nice tool, do check it out. Some conclusions:
- There is no real winner: it is completely dependent on which period you look at.
- The annualised performance in the fund currency of all four since inception was disappointingly low. Roughly between 1% and 3%.
- The periods where performance across the board looked acceptable are 1Y and 3Y, so 2025 and 2023-2025.
- Just like with the EUR bond funds, the short-term bond fund in USD looks attractive. Much less volatility.
My takeaways
- Asset diversification isn’t a silver bullet: When stocks and bonds crash together, standard rules go out the window. What 2022 taught me is that I need to actively monitor and manage risk.
- Every crisis is different: The chart at the top contains three crises. The relation between bonds and equity ETFs was significantly different for each.
- Stay active, don’t just hold: Blindly sticking to my plan in 2022 would have cost me real money. Watching the market and adapting when things got ugly saved me from much worse losses. I like the idea of passive investing, but I do need safeguards to protect my capital.
Note
Some numbers in this post come from tooling I built with AI, not directly from an official data source. Always verify against the original source and do the calculations yourself. Never trust random web pages like this one. Tool(s) used in this post: https://github.com/exvestigate/comparator.