A simpler portfolio setup
Written by editor on July 27, 2026

TL;DR
An 8-fund alternative to my full 14-fund portfolio, for less day-to-day complexity. Costs are about the same (0.22% vs 0.20% TER), but it comes with trade-offs: more concentration per fund, less visible EM exposure, and lower direct EUR exposure. Worth to take a look at if you'd rather keep things simple.
Why not simple?
This is the simplified take on the full portfolio I built across this series - if you’re arriving here directly, Part 1 has the objective and Part 6 has the full 14-fund version this one is based on.
I get it. Looking at a 14-line portfolio might make your head spin. Managing that many positions means more tracking, potentially higher transaction costs when rebalancing, and more psychological friction when it comes time to periodically sell units for your income stream.
In short, looks like work. And it is.
You do not need this level of granularity to have a quality retirement portfolio. My setup is highly personal to hit specific regional, currency, and factor targets. But I realise optimisation is the enemy of simplicity. It can be a real pitfall.
If you want to keep it simple, you can scale the portfolio down without compromising the leading principles.
By shifting from an optimised regional and factor satellite setup to a “no more than two funds per asset class” approach, you can slash the portfolio from 14 down to 8 funds. This cuts down on maintenance, rebalancing complexity, and transaction costs while keeping the underlying strategic asset allocation mostly intact. Check out the portfolio below.
Simple portfolio
The table below outlines every selected product and its absolute weight in the portfolio.
| Asset Class & Target Allocation | ISIN | Product Name | Portfolio Weight |
|---|---|---|---|
| Dividend & Value Stocks (45%) | |||
| IE00BL25JM42 | Xtrackers MSCI World Value UCITS 1C | 20% | |
| IE00B8GKDB10 | Vanguard FTSE All-World High Dividend Yield UCITS | 25% | |
| Market Stocks (30%) | |||
| IE0006WW1TQ4 | Xtrackers MSCI World ex USA UCITS | 15% | |
| IE00B6YX5C33 | State Street® SPDR® S&P® 500 UCITS | 15% | |
| Long Term Bonds (10%) | |||
| IE00B3F81R35 | iShares Core EUR Corporate Bond UCITS | 5% | |
| IE00B9M6RS56 | iShares J.P. Morgan $ EM Bond EUR Hedged UCITS | 5% | |
| Cash Equivalents (10%) | |||
| IE00BCRY6557 | iShares EUR Ultrashort Bond UCITS | 10% | |
| Gold (5%) | DE000A1EK0G3 | Xtrackers Physical Gold EUR Hedged ETC | 5% |
| Total Portfolio | 100% |
Table: Simplified version of portfolio
Definitely easier and still based on the same principles.
Equity allocation
The dividend/value and market stocks allocations (totalling 75%) are divided as follows:
| Region | Weight (% of total portfolio) | Weight (% of stocks) |
|---|---|---|
| Europe | 20.2% | 26.9% |
| US | 35.4% | 47.2% |
| Other | 19.4% | 25.9% |
Table: Regional split of the stock allocations
Against my Part 1 target of 30% Europe / 45% US / 25% Other, the equity part lands close to the US target, but is a bit light on Europe. This is the predictable result of dropping the two funds bought specifically for European exposure (more on that below).
Trade-offs
Cutting from 14 funds to 8 isn’t without consequences, of course. Here are the most important differences between the portfolio in part 6 and this simpler version:
- Emerging markets are hidden in other funds. The dedicated EM position (iShares Core MSCI EM IMI, 3%) is gone. What’s left is whatever EM slice already sits inside Vanguard FTSE All-World High Dividend Yield. That fund is global, so it carries some EM by construction, but you no longer control or see that weight directly. Xtrackers MSCI World ex USA is developed-markets-only, so it adds nothing here. Same story on the bond side: the unhedged USD Emerging Markets Government Bond fund (2.5%) is dropped, and the EUR-hedged EM bond fund is doubled to 5% instead. Total EM bond weight is unchanged, but all of it is now EUR-hedged. See the next point on why that is necessary.
- Direct EUR exposure is lower. In the full portfolio, direct EUR exposure was 25.50%, split across bonds/cash/gold and two equity positions bought specifically for their EUR exposure: Xtrackers Stoxx Europe 600 (3%) and Xtrackers Euro Stoxx Quality Dividend (2.5%). Together 5.5% of pure EUR equities. Both are dropped. The simple version lands at 25% direct EUR exposure (EUR corporate bonds 5%, EUR-hedged EM bonds 5%, EUR cash 10%, EUR-hedged gold 5%), but none of it comes from stocks anymore.
- Lower percentage of distributing ETFs. Xtrackers Stoxx Europe 600 (distributing) and the two dropped dividend/EM funds go away, and the freed-up weight is folded into the remaining, larger positions. Income still flows mainly through Vanguard FTSE All-World High Dividend Yield, but that single fund now carries 25% of the portfolio instead of 20%. The distribution stream is more concentrated in one product rather than spread across several. This is probably my biggest issue with this portfolio.
- Gold is now 100% currency-hedged. Part 6 held gold half in Xtrackers Physical Gold EUR Hedged (2.5%) and half in Invesco Physical Gold, unhedged (2.5%). The simple version drops the unhedged half and puts the full 5% into the EUR-hedged ETC. That’s good for the EUR-exposure target, but it also means the whole gold position now carries ongoing hedging cost/drag, and you lose gold’s usual role as a diversifier against USD weakness.
- More concentration per position. Fewer funds mean each one carries more weight, so any single index provider, methodology quirk, or fund-specific issue (e.g., a change in dividend methodology or a liquidity event) has a bigger effect on the whole portfolio. Vanguard’s FTSE All-World High Dividend Yield alone is now a quarter of the portfolio.
- TER is about the same. The TER is about 0.22%, versus 0.20% for the full 14-fund version in part 6. The equity ETFs are cheaper, but the EUR-hedged EM bond fund (0.50%) and EUR-hedged gold (0.59%) are more expensive. The saving from this portfolio is in your time and transaction costs, not in fund fees.
Rebalancing
A big plus of a simpler portfolio is that rebalancing is easier and cheaper. The core argument is straightforward: fewer assets mean simpler calculations. It just isn’t as much work as a more complex portfolio. This is the main advantage.
You will also probably have fewer transactions as a result of those calculations. Say you decide to rebalance twice a year. If you need to adjust 50% of your positions, that would be 2 x 7 = 14 transactions for the full portfolio vs. 2 x 4 = 8 for the simpler version. If each transaction costs €12, you save around €70 with the simpler portfolio. Not a staggering amount, but if you rebalance more often, it starts to add up.
Even simpler…
If you think even this simpler version is too complex, you’re in good company.
There are some classic 2- and 3-fund portfolios that reduce complexity even further. ETFatlas, for instance, has tons of examples. Set Fund Domicile to Europe on the left-hand side of the screen and currency to EUR on the right-hand side.
You can sort the portfolios and use the tabs at the top to see all kinds of interesting info. On the left, you can also set how many stocks and bonds you want in your portfolio.
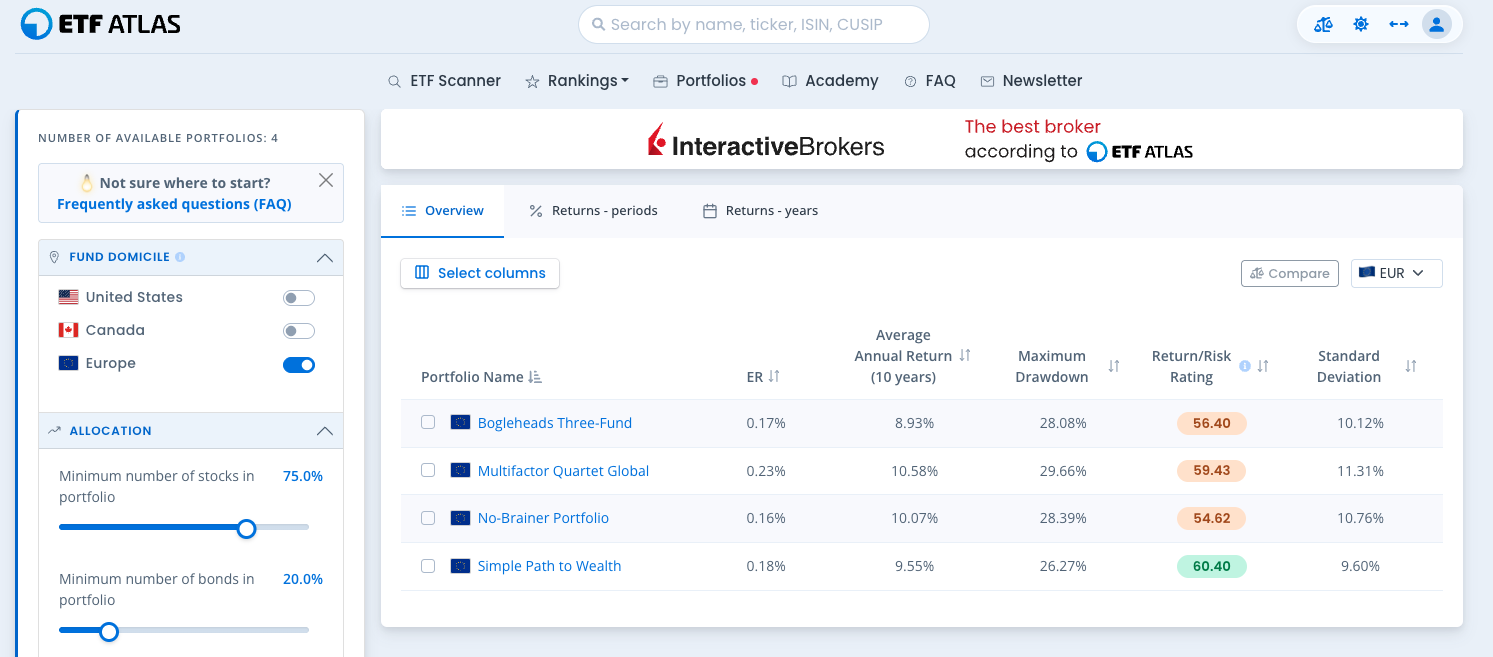
I quite liked the Fama-French Five-Factor Global. Simple, but with a good rationale behind it.
ETFatlas has a column called Return/Risk Rating which is based on three well-known indicators (Sharpe, Sortino and the Ulcer Index). This gives you a nice indication if the return of the portfolio is in line with the risk you take. More informative than just looking at the standard deviation.
One caveat: none of these model portfolios I looked at are built around a 40% EUR target or US underweight / Asia + Emerging Markets overweight. Going this much simpler probably means giving those up too, not just trimming fund count.
My takeaways
Really only one.
Your portfolio should fit not only your investment objectives but also your personal approach to investing. If you are not primarily interested in investing itself, but rather in the results, then keep it simple. It is not a bad idea to copy a model portfolio and work with that. As long as you know what you copied and what it provides or omits, that is perfectly fine.
I will stick with my complete portfolio as listed in part 6 because I want to control and guard my three extra conditions from part 1 to a high degree. For that, I need specialised products, so I can make precise corrections in my portfolio.