Part 9: The rulebook
Written by Editor on November 3, 2026
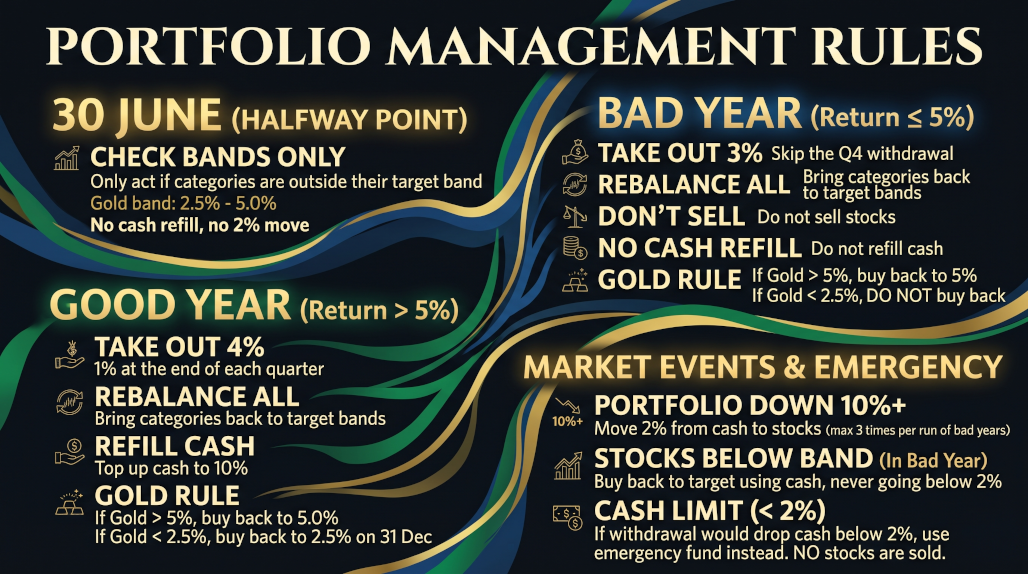
TL;DR
All the rules behind my retirement portfolio in one place. Targets: 75% stocks, 10% bonds, 10% cash, 5% gold and a 6% return. I take 4% in good years and 3% when the return is 5% or lower. I rebalance twice a year with 10% bands, keep cash between 2% and 10%, and never sell stocks in a bad year.
One place for all the rules
This post is part of a series on the construction of my portfolio.
Over eight posts I set a lot of rules for my portfolio. Some in Part 1, some in Part 8, a few in posts on dry powder and sequence of returns risk. Writing them down helped me to formulate how I want to manage my portfolio. But I need a good overview to see if my rules are consistent.
So this post collects every rule in one place. It is the checklist I will use myself at every rebalancing moment. If this post and an older one disagree, this post is leading.
These are also the rules incorporated in my withdrawal simulator, where you can see what they do over a whole retirement.
The “why” behind each rule is in the original posts. Here it is just the rules themselves: first all of them at a glance, then the details per topic.
Rules at a glance
Most rules depend on what kind of year it is:
- Good year: my portfolio returns more than 5% over the year (1 January to 31 December), including the money I took out during the year.
- Bad year: a return of 5% or lower. That includes a year that is still positive, like +3%.
| Situation | What I do |
|---|---|
| Good year (return above 5%) | Take out 4%: 1% at the end of each quarter |
| Bad year (return of 5% or lower) | Take out 3%: skip the Q4 withdrawal |
| Category outside its band | Back to target at the next rebalancing moment |
| 30 June - the halfway point | Only bands: categories outside their band, and gold outside 2.5% - 5%. No cash refill, no 2% move |
| Gold above 5% | Sell back to 5% at the next rebalancing moment |
| Gold below 2.5% | Buy back to 2.5% at the next rebalancing moment, but on 31 December only in a good year |
| Good year | Refill cash to 10% |
| Bad year | Don’t sell stocks, don’t refill cash |
| Portfolio down 10% or more | Move 2% from cash to stocks, at most three times per run of bad years |
| Stock category below its band in a bad year | Buy it back with cash, never below 2% |
| Withdrawal would take cash below 2% | The rest comes from my emergency fund. Nothing is sold |
Table: Rules at a glance
In the next sections, I review and summarise the complete setup. If you want to see examples of the rules in action, run some scenarios in my withdrawal simulator and see what rebalancing events can be triggered over a long period.
To make my life easier, I also used AI to create a rebalancing assistant. You can find it under tools as rebalancer. It will tell you exactly what to do and why you need to do it.
Okay, back to the complete overview.
1. Overall objective
From Part 1:
- My plan covers 20 years of retirement, starting around 65. The first 10 years matter most.
- Target: a 6% nominal return with reasonable risk.
- I take out 4% as income and leave 2% in to counter inflation.
- Portfolio volatility must stay at or below 10%.
2. Asset allocation
Here is a summary of my asset allocation and how I end up with my target 6% return.
| Asset class | Target | Band | Expected nominal return |
|---|---|---|---|
| Dividend & Value stocks | 40% | 36% - 44% | 8.5% |
| Market stocks | 35% | 31.5% - 38.5% | 6.5% |
| Euro bonds (> 1 year) | 5% | 4.5% - 5.5% | 4.5% |
| EM bonds (EUR hedged) | 5% | 4.5% - 5.5% | 3.5% |
| Cash equivalents | 10% | own rules, see section 7 | 2.5% |
| Gold | 5% (maximum) | 2.5% - 5%, see section 6 | 0.0% |
| Total | 100% | 6.33% |
Table: Target allocation, bands and expected returns
A band is 10% of the target weight, up or down. So 40% becomes 36% - 44%. Each of my two bond funds has its own band.
The expected returns are geometric averages, also called annualised returns or CAGR. A geometric average is the fixed yearly return that gives you the same end result as the real ups and downs. That is not the same as the simple (arithmetic) average of the yearly returns, which is always higher when returns go up and down.
A quick example. +50% one year and -50% the next gives an arithmetic average of 0%. But € 100 becomes € 150 and then € 75. The geometric average is -13.4% a year, and that matches what actually happened to the money. It is -13.4% because 100 * (1 - 0.134) * (1 - 0.134) ≃ 75.
For someone living off the pot, the geometric average is the one that counts. Michael Kitces explains it well, including why the gap grows when returns swing more (volatility drag).
The 6.33% for the whole portfolio is the weighted sum of the six expected returns. A good enough approximation for planning.
3. Portfolio conditions
Also from Part 1. I check these at every rebalancing moment:
- Currency: 40% of the portfolio in EUR or EUR hedged. Today it is about 27.5% direct and roughly 34% when including euro stocks inside global funds. My weak point.
- Regions, for the stock part: US 45%, Europe 30%, Other (Asia-Pacific and Emerging Markets) 25%.
- Distributions: at least 2% a year from dividends and interest.
- Products: 10 at most. How I select them is in Part 2.
4. Two types of cash
From dry powder and Part 8:
- Emergency fund, outside the portfolio. A boring bank account that keeps 4 years of income intact. Not part of my asset allocation. It takes over my income when the cash in my portfolio has reached its 2% floor.
- Cash equivalents (dry powder), inside the portfolio. 10% in a EUR ultrashort bond ETF. This is not grocery money; it protects my stocks from being sold in a downturn and helps to get my withdrawals.
5. Withdrawals
- My portfolio value on 1 January is my 100% for the year.
- At the end of each quarter I take out 1% of that value.
- Good year: a return of more than 5%, counting what I took out during the year. I take all four withdrawals: 4%.
- Bad year: a return of 5% or lower. I skip the withdrawal at the end of Q4: 3%.
An example. I start a year with € 100 000 and take out 3 * € 1 000 in the first 3 quarters. If I have € 101 000 left at the end of the year, my return is (€ 101 000 + € 3 000) / € 100 000 - 1 = 4%. A bad year: I don’t take my 4th withdrawal and go straight to rebalancing. With € 104 000 left, my return is 7%. A good year, so I do take the 4th € 1 000.
The money comes from three places, in this order (the drawdown waterfall from Part 8):
- Distributions from my funds. Normally around 2.4% a year.
- Cash equivalents, for the rest, but only down to 2%. Whatever is still missing comes from my emergency fund. I never sell stocks, bonds or gold to pay a withdrawal.
- In good years: selling stocks that have grown above their target at rebalancing (harvesting gains). This refills the cash.
6. Rebalancing
- I rebalance twice a year: on 30 June and on 31 December.
- On 30 June I only look at bands. Categories outside their band go back to target, and so does gold outside 2.5% - 5%. Cash pays for this, but never below 2%, and I don’t refill it. The good-year and bad-year rules wait for 31 December, because only then do I know what kind of year it was.
- A category is only corrected when it is outside its band (section 2). Then it goes back to its target.
- Gold has its own band: 2.5% - 5%, without the 10% margin the other categories have. Like every other adjustment, it happens at the next rebalancing moment, not when the limit is crossed:
| Gold weight | 30 June | 31 December, good year | 31 December, bad year |
|---|---|---|---|
| Above 5% | Sell back to 5% | Sell back to 5% | Sell back to 5% |
| 2.5% - 5% | Nothing | Nothing | Nothing |
| Below 2.5% | Buy back to 2.5% | Buy back to 2.5% | Nothing. Wait for a good year |
Table: Gold rules
In practice I will mostly trim.
7. Cash equivalents
Here is the short version of how I manage cash:
- Good year: rebalancing brings cash back to 10%.
- Bad year: I don’t refill cash.
- Down 10% or more: if my portfolio dropped 10% or more that year, I move 2% of the portfolio from cash into stocks. I do that at most three times during a run of bad years. A good year resets the count. This is how I buy stocks in a crisis instead of selling them.
- Floor of 2%: I don’t let a withdrawal take cash below 2%. Whatever my cash can’t pay, my emergency fund pays. I don’t sell anything for it. The one exception is 31 December in a good year: then rebalancing refills cash to 10% straight away.
A side note. In a real crash my cash drops less than other parts of my portfolio. Everything else falls more (with the possible exception of gold), so the share of cash is higher than you might expect.
8. Bad years
Let’s look at these in more detail. A bad year is a year with a return of 5% or lower. Then these rules apply:
- I take out 3% instead of 4%.
- I don’t sell stocks.
- I don’t refill cash to 10%.
- If gold or a bond fund is above its band, I sell the excess. The money goes into stocks, not into cash.
- I don’t buy gold or bonds. The 25% outside stocks is my shock absorber in a bad year: I only sell from it, and it gets topped up again in a good year.
- If a stock category falls below its band, I buy it back to its target with cash, as long as cash stays at 2% or more.
- If the portfolio dropped 10% or more, I also move 2% from cash into stocks (section 7).
- Cash never pays below 2%. The rest of my income then comes from my emergency fund (section 7).
So when things don’t turn around, my emergency fund takes over my income once cash reaches 2%. That is what it is for.
What may change
These rules are for the first phase of my retirement. Two things I already know I want to look at:
- Moving to 80% - 85% stocks once my sequence of returns risk has become acceptable, probably between 5 and 10 years into retirement.
- My EUR exposure. Still below the 40% I want.
When a rule changes, I will update this post first.